Have you ever watched a football match and wondered why a star player seems to disappear, or why a team’s attack suddenly stalls? The answer often lies not in the goals or the saves, but in the silent, statistical language of a pass map. These intricate networks of dots and lines, which track every single pass between players, are now the most revealing tool for understanding the modern game. They offer a unique, X-ray vision into a team’s tactical soul. For fans at Baji Live, who crave more than just a final score, these maps unlock the secrets of formation, tempo, and player relationships. They tell us why Liverpool’s Mohamed Salah is most dangerous when he gets the ball in specific zones, and how Manchester United’s entire left flank crumbles without Luke Shaw. This isn’t just data; it’s the story of how football games are truly won and lost.
Decoding the Data: What is a Pass Map and Why Does It Matter?
A pass map is a visual representation of every successful pass made by a team during a match. Each player is represented by a dot (or circle), and the lines between them indicate passes exchanged. The thickness of a line shows the frequency of passes between those two specific players. The position of the dots reveals a team’s average shape, while the connections expose their primary attacking and defensive patterns. This tool allows analysts to see beyond the eye test, confirming or challenging our observations about a team’s performance.
More Than a Formation
While a traditional formation graphic (like a 4-3-3) is a starting point, a pass map shows reality. A team might line up in a 4-3-3 on paper, but their pass map could reveal they actually play with a back three in possession, with the full-boys pushing high. For instance, if the lines between the center-halves and the goalkeeper are thick, it indicates a team building from the back. Conversely, many direct passes from the goalkeeper to a forward would show a different tactical approach. This data gives us a profound understanding of how a manager wants the team to play.
The Key Metrics in a Pass Map
When analyzing a pass map, experts look for a few key things:
- Centrality:Which players are the hub of the team’s possession? A thick web of connections around a central midfielder, like Rodri at Manchester City, indicates they are the metronome.
- Clusters:Are players isolated? A lack of lines connecting a forward, for example, suggests they are being starved of service.
- Progression:Where are the passes going? Are they primarily sideways in the defensive third (lateral), forward into the final third (progressive), or back towards the goal (regressive)?
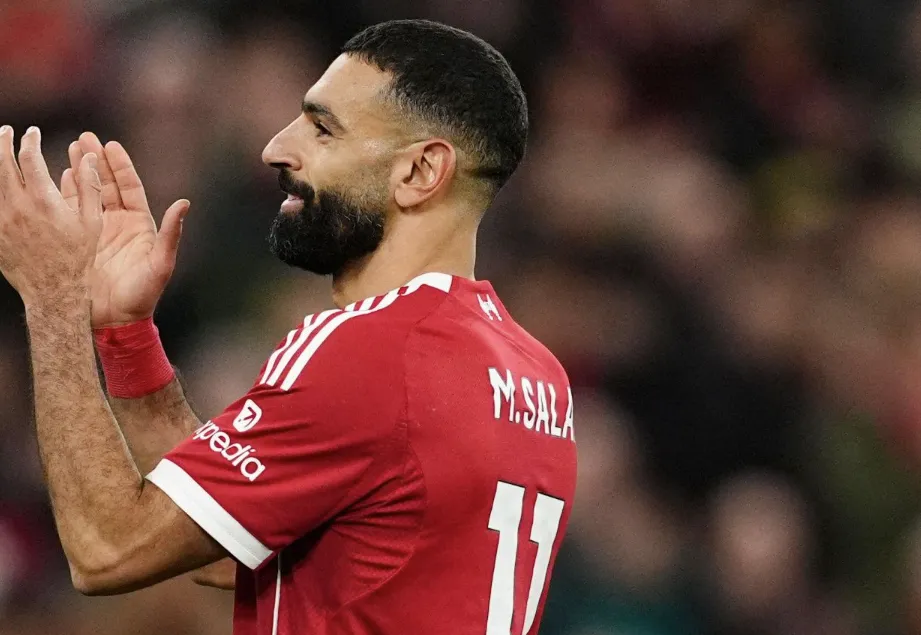
Mohamed Salah’s Isolation: The “Needs the Ball” Dilemma
The pass maps for Liverpool this season have told a fascinating and sometimes frustrating story regarding Mohamed Salah. While he remains their primary goal threat, the maps often show him as a somewhat isolated figure on the right wing. The data doesn’t lie: Salah’s influence is directly tied to the number of times the ball finds him in the right half-space between the full-back and center-back. When Liverpool are dominant, the lines between Salah, the right-back (often Trent Alexander-Arnold), and the central midfielders are thick and numerous.
The Problem of Being Starved
However, against top-tier opposition or when Liverpool are under pressure, the pass map reveals a different reality. Salah’s dot can appear disconnected, with few lines coming his way. This isn’t a lack of effort, but a tactical consequence. Opponents have learned to double and triple-team him, effectively cutting the supply lines. The map will show a heavy dependency on the right side, but a failure to actually get the ball to him in dangerous positions.
Dr. James O’Brian, a football analytics expert, stated, “Mohamed Salah’s heatmap and pass matrix show he is a high-risk, high-reward player. If the team can’t get him the ball in advanced positions, his output drops dramatically. The pass map is the clearest indicator of whether Liverpool are managing to break the first line of the press to serve him.” For fans at Baji Live, watching Salah’s pass map is like watching a striker’s xG. When his connections are yellow, it’s a warning sign.
Manchester United’s Left-Side Dependency: The Luke Shaw Factor
Manchester United’s tactical identity has been a subject of much debate, but the pass maps this season point to a stark reality: an overwhelming reliance on the left flank, particularly on the fitness and form of Luke Shaw. The maps consistently show a high density of passes on the left side of the pitch, connecting Shaw with players like Bruno Fernandes, Marcus Rashford, and the left center-back.
A Structural Weakness
When Luke Shaw is playing, his connecting lines are the thickest on the team. He is the primary progressive passer from the back, often overlapping to create width and providing key link-up play. The map shows a clear design where the team looks to overload the left side, drawing the opposition in before switching the ball to the right. However, this creates a profound weakness.
When Shaw is injured or underperforming, the entire left-side structure collapses. The pass map becomes disjointed. The left-back’s dot is often positioned deeper and has fewer vertical connections. This forces Rashford to drop deeper to get the ball, pulling him away from his most dangerous areas. The heavy reliance on one player makes the team predictable and fragile. Former Manchester United coach, Rene Meulensteen, noted, “The pass map is a reflection of faith. If the players don’t trust the right side, all the passes go left. It becomes a systemic problem, not a personnel one. Luke Shaw isn’t just a player; he’s the system.”
The Consequences of Imbalance
This lopsidedness is a major tactical talking point. The pass map from a match against a high-pressing team, like Brighton, will show United’s inability to progress the ball centrally. The lines from the center-halves are often directed to the left-back, making the team one-dimensional. It forces the right-back, often Diogo Dalot, to become a more progressive passer, a role he is not naturally suited for. This isn’t just a problem of performance; it’s a structural issue exposed daily by the pass map.
Conclusion: The Future of Tactical Analysis
The pass map has revolutionized how we understand football. It has transformed vague concepts like “build-up play” and “attacking shape” into quantifiable data. For Mohamed Salah, the map confirms his need for constant service. For Manchester United, it exposes a crippling dependency on Luke Shaw. These are not opinions; they are visual facts. As fans, we are no longer passive observers. With tools like pass maps, we can now see the game’s hidden structures, cut through the noise of punditry, and analyze the sport with the depth of a professional coach. The data is there for everyone to see at Baji Live, telling the real story of the game. What will your next match analysis reveal? Share your thoughts in the comments below!